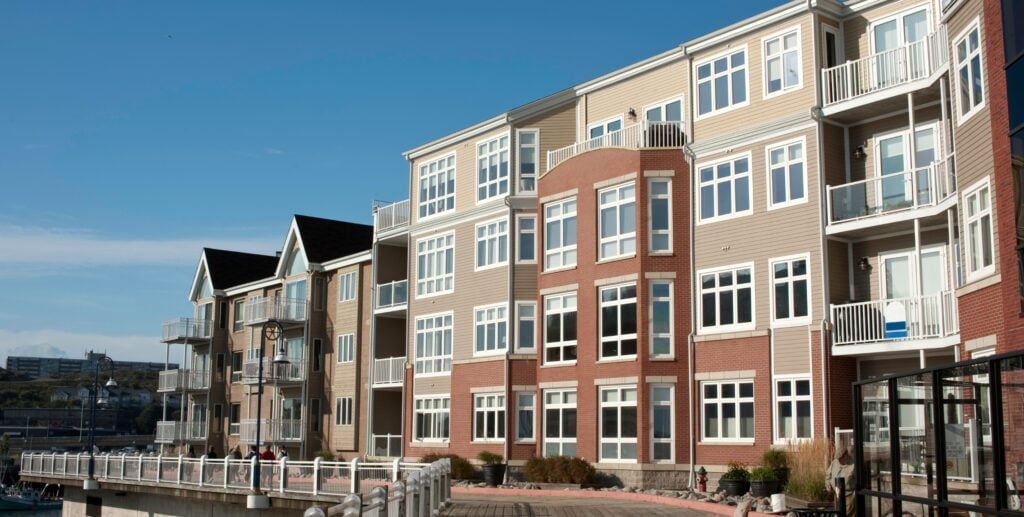
For several months now, I and many others at BiggerPockets have been cautioning that the multifamily market is at severe risk of declining property values—even as the residential market proves resilient. But has a “correction” or perhaps even a “crash” materialized in the multifamily market? Let’s take a look.
The National Multifamily Market is in Bad Shape
As a brief primer, multifamily assets (along with many other commercial asset classes) are valued based on net operating income (NOI) and cap rates. When NOI increases, it puts upward pressure on values. In contrast, when cap rates rise, it puts downward pressure on values.
What we’ve seen on a national level over the course of 2023 are conditions that don’t look good for multifamily property values.
Rising cap rates
First, we have rising cap rates. Cap rates can rise for all sorts of reasons, as they are a function of investor sentiment, but the cost of capital, a glut of supply, and slowing rent growth are some of the main reasons cap rates have risen in recent months. According to CoStar, the average market cap rate has risen from 4.9% to 5.6% from Q2 2022 to Q2 of this year.

This may not sound like a lot, but it makes a big difference in valuation. As an example, take a property with a net operating income of $100,000. One year ago, the average market cap rate in the U.S. was 4.9%. This would give this fictional property a roughly $2.04M value ($100,000/.049). Fast forward one year and the average market cap rate in the U.S. is now 5.6%, making the property worth about $1.78M—a 13% decline in value in just one year.
Slowed growth
But cap rates are just one side of the equation here. If NOI were to grow, it could offset rising cap rates. Happily, for multifamily investors, rental income has grown year-over-year but at a much slower pace than has been seen in over a decade.

This slowdown in rent growth is due to a variety of factors, such as a glut of supply and rising vacancy. According to RealPage, rent growth is now under 1% YoY, meaning it is not even keeping up with inflation. Rising rents could theoretically help offset rising cap rates, but from CoStar’s data, it’s not enough.
These two things combined have led to lower sales prices for multifamily assets, particularly among higher-tier buildings. Looking at the chart below, you can see four and five-star buildings (subjective rankings from CoStar) have fallen much faster than three-star buildings, which are relatively flat.

On a broad national level, multifamily assets are in a correction. Of course, what happens in each individual market and each individual asset class is different.
While no one knows for certain what will happen next, if you believe CoStar’s forecasts (which you can see in the charts above), multifamily prices are poised for further declines. Costar is forecasting cap rates to continue marching upward to an estimated 6.5% towards the end of 2024. During that time, rents are projected to grow 4% nationally. If all this came true, at the end of 2024, we could expect a value of roughly $1.6M—an additional ~10% decline from where we are today and a more than 20% decline peak-to-trough.
What Does This Mean for Investors?
With multifamily pricing facing downward pressure, combined with turmoil and uncertainty in commercial lending, it’s a time for caution in this asset class. There can and will certainly be deals, particularly if there is seller distress or if you plan to add value. But be very selective about what you buy and where. There are likely to be many headwinds in the multifamily space for the foreseeable future.


